
A district can run three monitoring tools and still not know why a state assessment stalled in the west wing at 9:40 on a Tuesday. Not because the tools were bad. Because all three were answering the same question.
Uptime polling says the switch is reachable. Bandwidth graphs say the circuit is at 38 percent. Both are true. Neither one can tell you that eighty students in one building failed to complete the DHCP handshake because a single access point was saturated, or that the assessment vendor’s authentication endpoint was slow for four minutes in your region.
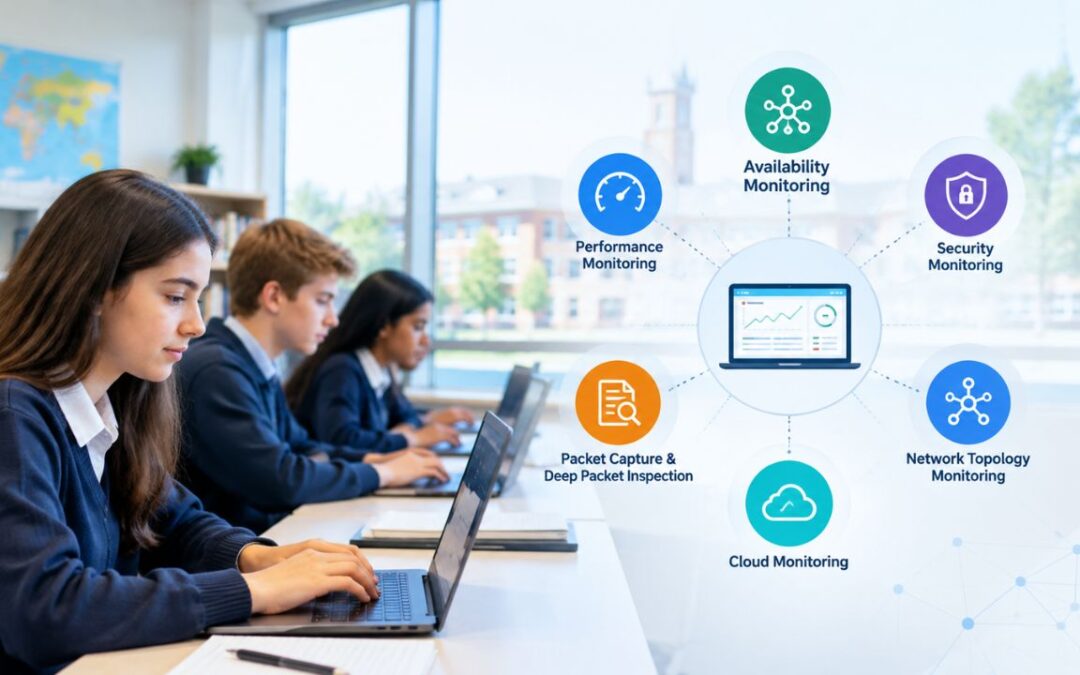
There are roughly eight distinct types of network monitoring in production use across education, and they detect completely different classes of failure. Districts and campuses that struggle with visibility almost never have too few tools. They have too many tools of the same type and zero coverage of the other five.
1. Availability monitoring
What it does: Confirms that a device, interface, or service is reachable and responding. ICMP pings, TCP port checks, and basic SNMP polling on a fixed interval.
This is the floor of every monitoring stack and the type schools deploy first. It answers one binary question well: is this thing alive. For a district with buildings that lose power or fiber, that binary matters, and an alert at 5 a.m. that the middle school uplink is down is genuinely worth the license.
Where it goes blind is everything short of total failure. An access point that is up but rejecting half its association attempts passes an availability check. So does an LMS returning errors with a healthy HTTP 200 wrapper. Districts that treat availability as their monitoring strategy are running the equivalent of a smoke detector and calling it a fire plan.
2. Performance and bandwidth monitoring
What it does: Polls interface counters, typically over SNMP, to track utilization, throughput, errors, discards, latency, and jitter over time.
This is the type most people picture when they hear network monitoring, and in education it earns its place for one reason beyond troubleshooting: it produces the historical utilization record that justifies funding. A district asking for a Category 2 refresh through the E-Rate program is far more persuasive with twelve months of per-building saturation curves than with a vendor quote and an argument.
The limitation is that utilization tells you a link was busy, never why. Across most education network assessments, the interesting finding is not the saturated uplink. It is the interface error counter that has been quietly climbing on one closet switch for six weeks because of a failing optic, which nobody noticed because nobody alerts on discards.
3. Flow and traffic analysis
What it does: Collects metadata about conversations crossing the network using NetFlow, sFlow, or IPFIX, showing which endpoints talked to which destinations, over which ports, and how much they moved.
Flow monitoring is the type most underused in K-12, and it answers the question every other type dodges. When the circuit saturates during the third period, flow data names the source. In practice that source is frequently not instructional: cloud backup jobs scheduled during school hours, a misconfigured update service pulling images to four hundred devices at once, or streaming that filtering rules did not catch.
It also has real security value. Unexpected outbound destinations, sudden internal east-west traffic between subnets that should not converse, and a device beaconing on an odd port all show up in flow records before they show up anywhere else.
The tradeoff is storage and analysis. Flow data volume grows fast, sampling rates change what you can prove, and raw flow records are useless without a collector that summarizes them. Districts that turn flow on without planning retention typically abandon it within a term.
4. Packet capture and deep packet inspection
What it does: Captures actual packets from a SPAN port or TAP for protocol-level analysis.
This is a forensic type, not a continuous one. When a problem is intermittent, protocol-specific, and has survived every other layer of investigation, packet capture is what resolves it. Authentication handshake failures, DHCP exhaustion, multicast misbehavior in a lecture capture system, and unexplained packet loss are classic cases.
It is also the type with the sharpest compliance edge in education. Packet capture can expose the contents of student traffic, which puts it directly inside FERPA territory. Any district running captures needs a written scope, a retention limit, and a clear answer to who can view the data. The common mistake is standing up a capture appliance for troubleshooting and never defining a policy, which turns a diagnostic tool into an audit finding.
5. Wireless and access layer monitoring
What it does: Tracks access point health, client counts per radio, channel utilization, retry and roaming behavior, signal quality, and association or authentication failures.
For education this is arguably the highest-value type per dollar, because the overwhelming majority of user complaints originate in the last thirty feet. Wired infrastructure in schools is comparatively stable. Wi-Fi is where the bell schedule hits.
There is a meaningful split inside this type. Controller-side wireless monitoring reports what the infrastructure observed. Client-side wireless monitoring, using sensors or endpoint agents, reports what a device in that specific room actually experienced, including the failed connection attempts that never reached the controller at all. Those two data sets disagree more often than most teams expect, and the disagreement is usually the answer.
6. Application, cloud, and SaaS monitoring
What it does: Measures the response time and error behavior of the applications people actually use, including transaction timing, dependency mapping, and third-party service health.
Since the LMS, SIS, assessment platform, and identity provider all left campus, this became the type that separates a district that can defend itself from one that cannot. When the assessment window goes badly, the question is whether the fault was local or vendor-side. Without application performance monitoring, the district has an opinion. With it, the district has a timeline.
The standard approach is to rely on the vendor’s public status page. That fails routinely, because status pages update after an incident is confirmed and reflect global state rather than what your region or your tenant experienced. Regional and tenant-level degradation is common and almost never posted.
7. Synthetic and active monitoring
What it does: Runs scripted transactions on a schedule from fixed points on the network. Log into the LMS, load a course page, resolve DNS, complete an SSO handshake, and record how long each step took.
Synthetic monitoring is the only type that finds problems before users do, which makes it disproportionately valuable in education because of scheduling. A district that runs a synthetic LMS login from three buildings every five minutes knows at 6:15 a.m. that authentication is slow, not at 8:05 when six hundred students discover it simultaneously.
It is also the type that makes remote and hybrid instruction defensible, and the type most districts skip because it requires deciding what a critical transaction is and writing it down. That work is the point. Institutions that cannot name their five critical transactions do not have a monitoring problem. They have a priorities problem.
8. Log, event, and configuration monitoring
What it does: Aggregates syslog, device events, authentication records, and configuration changes, then alerts on patterns and unauthorized modifications.
Two distinct jobs sit here. Configuration monitoring catches the change that broke something, which in education is usually a well-intentioned change made during a break week by someone who did not document it. Backing up switch configs and alerting on diffs resolves an entire category of mystery outages.
Log and event monitoring is the security-adjacent half. Repeated failed authentications, privilege changes, and unusual admin access are the early signals in most district incidents. This does not replace a dedicated security stack, and any vendor implying otherwise should be treated with suspicion, but the network layer frequently sees it first.
The mix most institutions actually need
A small district running a single campus generally needs availability, performance, wireless, and synthetic monitoring of three or four critical transactions. Flow can wait until the first unexplained saturation event, which will arrive.
A multi-building district needs everything in that list plus flow analysis and configuration monitoring, because the failure modes multiply with sites and because nobody remembers what changed in building four.
A university needs all eight, with client-side wireless monitoring and application monitoring weighted heavily, because the complaint volume is dominated by residential Wi-Fi and by research or LMS platforms that live off campus.
What almost nobody needs is three products that all do availability and performance. That is the most common stack in education, and it is why the dashboards stay green while the tickets keep arriving.
Buying another tool of a type you already own does not add visibility. It adds a second opinion about the same corner of your network.
Where to go from here
The real cost of a lopsided monitoring stack is not downtime. It is the credibility that drains away every time IT tells a faculty member the network is fine and the faculty member knows it is not. That erosion is what sinks technology budgets at board meetings.
Audit your stack by question, not by product count. Take the last ten escalations, map each to one of the eight monitoring types above, and mark which ones you could answer with data rather than a theory. The gaps show up immediately, and they are rarely where the budget went.
If you want a second read on which types your institution is missing, talk to Splitpoint. Network, infrastructure, application, and end-user experience data in one place is the shortest path to answering every one of those questions without running eight products.
FAQ
What are the main types of network monitoring used in schools?
Eight types are in common use: availability monitoring, performance and bandwidth monitoring, flow and traffic analysis, packet capture, wireless and access layer monitoring, application and cloud monitoring, synthetic and active monitoring, and log and configuration monitoring. Each detects a different class of failure, and most districts over-invest in the first two.
What is the difference between active and passive network monitoring?
Passive monitoring observes traffic and device counters that already exist, including SNMP polling, flow records, and packet capture. Active monitoring generates its own traffic, such as synthetic transactions and scripted logins, to test a path before users depend on it. Education networks need both, because passive monitoring only reports problems after somebody has already hit them.
Which type of network monitoring is most important for K-12 districts?
Wireless and access layer monitoring usually delivers the most value per dollar, because the majority of user complaints originate in the last thirty feet rather than in the core. Availability and performance monitoring remain the required baseline, and synthetic monitoring of the LMS and SSO is the highest-value addition most districts have not made.
Do schools need flow monitoring like NetFlow or sFlow?
Flow monitoring becomes necessary as soon as you need to know what consumed bandwidth rather than that bandwidth was consumed. It regularly identifies non-instructional traffic such as cloud backup or update jobs running during school hours, and it surfaces unusual outbound activity that other monitoring types miss.
Is packet capture allowed in schools under FERPA?
Packet capture can expose the contents of student traffic, which places it within FERPA considerations. It is generally used for defined troubleshooting rather than continuous operation, and districts should set a written scope, a short retention window, and restricted access before deploying it.
How does network monitoring support E-Rate funding requests?
Historical performance and bandwidth data demonstrates the need behind a Category 2 request under the E-Rate program. Twelve months of per-building utilization and saturation data is materially more persuasive to reviewers and to school boards than a vendor quote alone.
Why do monitoring dashboards show green while users report problems?
Because availability and performance monitoring watch infrastructure, not experience. Wi-Fi client-side failures, DNS or single sign-on latency, and vendor-side SaaS degradation all sit outside SNMP polling of switches and circuits, so they never appear on the dashboard even while they are the actual cause.