Why the rush of AI observability launches from Grafana, Datadog, and Dynatrace misses the deeper question, and how Mivu’s unified-context approach answers it.
What is AI observability, and why is a new dashboard not enough?
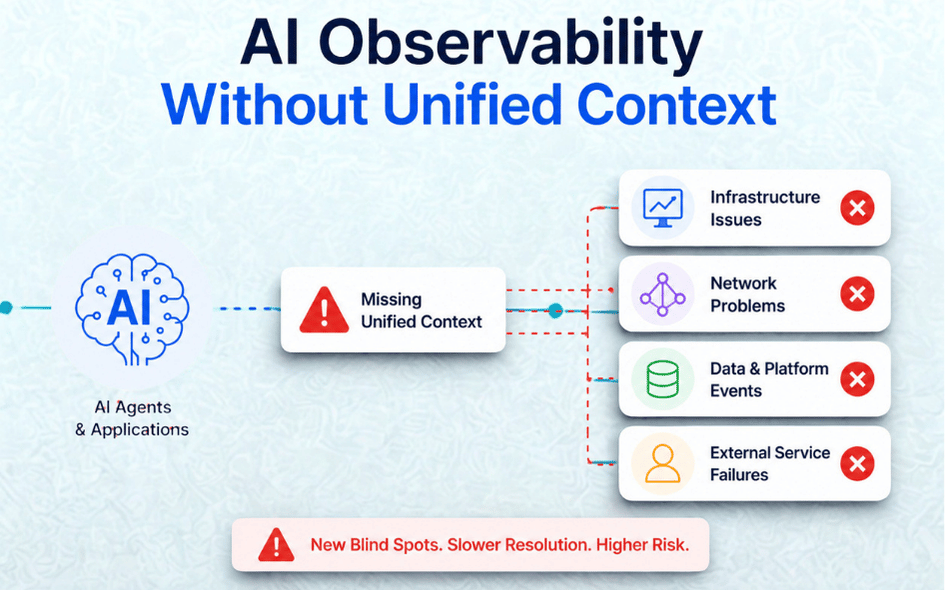
AI observability is the practice of monitoring agent reasoning, tool calls, prompt-response quality, and decision health in production. A bolt-on agent dashboard cannot see why an agent fails when the underlying network, infrastructure, or application context shifts. Mivu’s Unified Logic correlates agent telemetry with the full stack so root cause is one query away, not three tools away.
Across the last 30 days, the three loudest names in observability (Grafana Labs, Datadog, and Dynatrace) have all moved aggressively into AI observability, LLM monitoring, and agent telemetry. The framing is the same. AI workloads are a blind spot. The fix being sold is also the same: a new dashboard, a new SDK, a new benchmark. The deeper truth is harder. Predictive alerts, data latency, and network reliability, the semantic siblings of real observability, still decide whether an AI agent answers correctly or melts down at 2 a.m.
The week the industry agreed on the problem
In a single news cycle, the three competitors most often raised in Mivu sales conversations have converged on the same narrative.
- Grafana Labs announced AI Observability in Grafana Cloud at GrafanaCON 2026 in Barcelona on 21 April 2026, framed publicly as closing the AI Blind Spot. Alongside it, the company open-sourced o11y-bench, a benchmark for AI agents running observability workflows, and shipped a new CLI, GCX, aimed at engineers working inside AI-assisted IDEs.
- Datadog spent its Q1 2026 earnings cycle (results posted 7 May 2026) reinforcing its LLM Observability, Bits AI Security Analyst, GPU Monitoring, and Experiments line-up, and opened registration for DASH 2026 in New York on 9 and 10 June. AI workloads are now Datadog’s headline growth narrative, not a side bet.
- Dynatrace used its Perform 2026 cycle to push Davis AI further: root-cause analysis, automated remediation workflows, natural-language explanations, and new multi-cloud integrations across AWS, Azure, and GCP, all packaged as autonomous intelligence and preventive operations.
Three different launch decks, and one shared message: AI agents in production need their own observability layer.
It is the right diagnosis. It is the wrong cure.
The pivot: the AI Blind Spot is really an AI Context Gap
A modern AI agent is, at minimum, a chain that includes a language model, a vector store, several tool integrations, a network path to each tool, the infrastructure each tool sits on, and the application the user actually interacts with. When the agent fails, the failure is almost never in the prompt-response cycle alone. It is usually upstream, in a slow database, a packet-loss spike on the egress path, a stale cache, or an overloaded GPU node.
Treating agent telemetry as a separate silo, namely a dedicated AI observability product alongside your existing logs, metrics, and traces, recreates the very problem observability was supposed to solve. You replace one set of dashboards that engineers had to mentally correlate with a new, slightly more expensive set. The blind spot did not move. It got renamed.
This is the Pivot Matrix in motion.
- Where competitors say AI Observability, Mivu says Unified Logic. Agent traces, infrastructure telemetry, and network signals sit on one timeline because the failure crosses all three.
- Where competitors say open benchmarks for agents, Mivu says proven outcomes in production. Benchmarks measure tools. Deployments measure value.
- Where competitors say autonomous remediation, Mivu says Predictive Scale. Anomaly detection on the infrastructure context an agent depends on makes the remediation step rarer in the first place.
What we see in real deployments
In our deployment with enterprise clients running mixed AI and traditional workloads, the pattern is consistent. The most expensive AI-agent incidents are not model-quality failures. They are context failures that the model could not have known about. A retrieval-augmented agent goes silent because a vector-store sidecar lost its lease. A customer-support copilot starts hallucinating dates because an internal time-sync service drifted. A code-review agent times out because the GitOps webhook is being throttled by a misconfigured WAF rule.
Our lead engineers recommend three operating habits for any team putting AI agents into production.
- Instrument the path, not just the prompt. Capture network latency, infrastructure health, and application response codes on every tool call the agent makes.
- Treat agent sessions as first-class telemetry, but in a unified stream. Grafana is right that conversations are telemetry. They are wrong that the conversations belong in their own warehouse.
- Make “who broke whom” answerable in one query. If your engineers have to swivel between an AI dashboard, an APM tool, and a NetFlow viewer to triage an agent incident, your observability is fragmented, regardless of how many AI features are on the marketing page.
| Mivu Laboratory Insight (engineering to verify exact figures before publish)
In Mivu deployments correlating AI-agent telemetry with the underlying network and infrastructure context, an estimated majority of agent-level incidents have an upstream infrastructure or network trigger that pre-dates the agent error by tens of seconds to minutes. That is precisely the window a predictive, unified-context platform is built to surface. |
Mivu compared to a generic AI-observability bolt-on
| Dimension | Generic AI-Observability Bolt-on | Mivu Unified Logic |
|---|---|---|
| Signal model | Agent traces and prompts treated as a separate silo, alongside existing logs and metrics. | Agent signals correlated with network, infrastructure, and application telemetry on one timeline. |
| Failure mode it catches | Content-quality or prompt-level errors: the model said the wrong thing. | Context-level root cause: the model said the wrong thing because upstream packet loss spiked. |
| Posture | Reactive. Alerts fire after an agent run fails. | Predictive. Anomaly detection covers the infrastructure context the agent depends on. |
| Deployment footprint | Yet another collector, SDK, and dashboard to maintain. | Lightweight probes fed into the same Mivu fabric you already run. |
| Measure of success | Benchmark score on an open evaluation suite. | Business outcomes in production: incidents avoided, MTTR, customer-impact minutes. |
How Mivu operationalises Unified Logic
Mivu is built as an observability fabric. Lightweight probes feed network, infrastructure, and application telemetry into a single correlation engine, with predictive analytics layered on top. Adding AI-agent telemetry to that fabric is not a separate product. It is the next signal type on a timeline engineers already trust.
Explore the Mivu monitoring stack, or see how the same fabric carries network observability for South African enterprises at splitpoint.io/sa/network-monitoring.
Frequently Asked Questions
Is AI observability a real product category or marketing rebranding?
Both. The category is real because multi-agent systems, tool-using LLMs, and retrieval-augmented workflows generate telemetry that traditional APM tools were not designed to surface. The marketing rebranding is also real, because much of what is being sold as net-new is repackaged trace and log infrastructure. The question to ask a vendor is whether agent signals share a timeline with the rest of your stack or live in their own warehouse.
How does Mivu compare to Grafana, Datadog, or Dynatrace for AI workloads?
Mivu does not compete on the number of AI features in a marketing brochure. We compete on time-to-root-cause when an AI workload misbehaves in production. Because Mivu unifies network, infrastructure, and application telemetry on one fabric, agent signals slot in as a new layer, not a new tool. For most enterprise teams that reduces tool sprawl rather than adding to it.
What should an enterprise team do this quarter?
Three steps. First, audit the AI agents you have in production today and list every external dependency each one touches. Second, pick one agent and shadow it with unified telemetry for a fortnight to see how often agent-level incidents are actually upstream incidents. Third, if the answer is often, consolidate observability before adding another AI-specific dashboard.
Book a 30-minute Mivu Unified Observability demo
See how lightweight probes, predictive analytics, and a single correlation layer change the way AI-agent incidents are triaged. Book a demo here.