
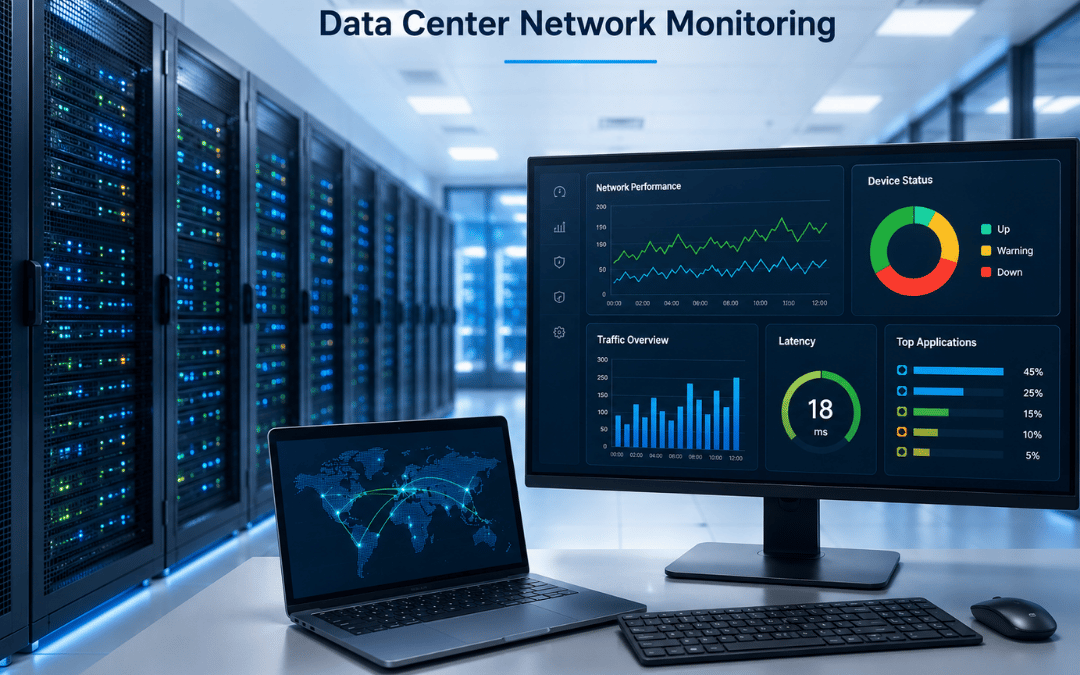
Your data center network switch is probably the most monitored device you own and the least understood. Most IT teams poll every switch with SNMP, collect thousands of metrics, and still learn about outages from a user complaint. The data exists. The visibility does not.
The cost of that blind spot keeps climbing. The Uptime Institute’s 2025 Annual Outage Analysis found that IT and networking issues caused 23 percent of impactful outages in 2024, a share that keeps growing as environments become more complex. More than half of organizations say their most recent significant outage cost over $100,000, and one in five put the figure above $1 million.
The problem is rarely a lack of tools. It is a lack of method. These seven best practices for effective data center network monitoring separate teams that catch problems early from teams that reconstruct them afterward.
1. Map Your Topology and Baseline Every Switch
Effective monitoring starts with knowing what normal looks like on every device you care about. Before a single alert is configured, you need two things: an accurate topology map showing how core, aggregation, and access layers connect, and a performance baseline for each switch on that map.
The baseline should capture at least two to four weeks of behavior: port utilization by time of day, CPU and memory ranges, error rates, and typical east-west traffic volumes between racks. Without this, every threshold you set is a guess dressed up as a policy.
In the majority of environments we assess, topology documentation is either missing or six months out of date. Teams monitor the switches they remember, not the switches that matter. A forgotten aggregation switch carrying storage replication traffic is a common single point of failure that nobody is watching.
One caveat: not every port on every access switch needs deep monitoring. Prioritize core switches, uplinks, interconnects, and devices supporting revenue-critical applications. Depth where it counts beats coverage nobody reads.
2. Monitor Switch Health and Traffic as Two Separate Disciplines
Switch health and switch traffic fail in different ways, and lumping them into one dashboard hides both. Health monitoring covers the device itself: CPU, memory, temperature, fan status, power supplies, and
hardware error logs. Traffic monitoring covers what moves through it: bandwidth utilization, packet loss, CRC errors, discards, and protocol distribution.
Platforms such as Mivu help IT teams monitor both operational health and network traffic together, making it easier to identify whether an issue originates from hardware degradation or changing traffic patterns.
A data center network switch can be perfectly healthy while congestion ruins application performance. It can also be quietly dying, with rising temperature and degrading fans, while traffic flows normally right up until the moment it does not.
Hardware failures rarely arrive without warning. Syslog entries showing temperature creep, voltage fluctuation, or fan degradation typically appear days or weeks before a critical failure. Teams that review these signals catch the failing power supply on a Tuesday afternoon. Teams that only watch bandwidth graphs meet it at 2 a.m.
Most monitoring setups we review track traffic thoroughly and health superficially. Reverse that bias. Traffic problems degrade service. Health problems end it.
3. Track Configuration Changes Like Outage Warnings
The single most common cause of network-related outages is not hardware. It is people changing things. Uptime Institute’s resiliency research consistently finds configuration and change management failure at the top of the list, cited by 45 percent of respondents as the cause of their networking outages, ahead of third-party provider failures and hardware faults.
Your platform should treat a configuration change on a switch as an event worth correlating, not background noise. When latency spikes at 14:32 and a config push happens at 14:29, that correlation should be visible in seconds, not uncovered through interviews two days later.
Practical steps that hold up in real environments:
- Log every configuration change with who, what, and when, and feed those logs into the same platform that holds your performance data
- Alert on unauthorized or out-of-window changes immediately
- Snapshot configurations so you can diff current state against last known good
- Review change records as the first step of any incident investigation, not the last
Everyone builds alerts for device failures. Almost no one builds alerts for the changes that cause them.
4. Set Dynamic Thresholds, Not Static Ones
Static thresholds create two failure modes: alert storms that teams learn to ignore, and silent problems that never cross an arbitrary line. Anchor thresholds to your baseline instead of a number that felt reasonable in a planning meeting.
A fixed alert at 80 percent utilization means nothing useful on a link that peaks at 85 percent every backup window and idles at 20 percent otherwise. A dynamic threshold that fires when utilization exceeds 90 percent of the observed peak for that hour catches genuine anomalies and stays quiet during known cycles.
Alert design deserves the same discipline:
- Start with fewer alerts than you think you need, then add based on incidents
- Suppress downstream alerts when an upstream device fails, so one switch failure does not produce three hundred notifications
- Route alerts by severity: page a human for service impact, ticket the rest
- Review thresholds quarterly, because traffic patterns shift as workloads change
Across most environments we audit, alert fatigue does more damage than missing tooling. When every alert pages a human, none of them matter. An ignored alert is worse than no alert, because it creates the illusion of coverage.
5. Extend Visibility Across Modern Data Center Networking Technologies
SNMP polling of physical devices no longer describes your network, because your network is no longer only physical. Modern data center networking technologies include virtual switches inside hypervisors, overlay networks such as VXLAN, software-defined fabrics, and hybrid links into public clouds. Traffic between two virtual machines on the same host may never touch a physical port at all.
East-west traffic now dominates most data centers, yet many monitoring deployments still concentrate on north-south flows at the edge. If your visibility ends at the physical access layer, a growing share of your traffic is invisible.
Closing the gap takes a layered approach. Flow protocols such as NetFlow and sFlow reveal who talks to whom. Streaming telemetry provides near real-time state from modern switch operating systems at a granularity SNMP polling cannot match. For links where packet-level truth matters, network TAPs and packet brokers feed complete traffic copies to analysis tools without burdening the switches themselves.
The standard advice is to buy a bigger monitoring platform. In practice, the platform is rarely the constraint. The constraint is whether complete, accurate data reaches it. A sophisticated tool watching sampled traffic from half your fabric produces confident answers about a network that does not exist.
6. Correlate Switch Metrics With Application and User Experience
A green network dashboard means nothing if applications are slow. Switch-level metrics tell you a device is functioning. They do not tell you whether the payroll system is responding or whether users in the Chicago office can load the CRM. Effective data center network monitoring connects infrastructure data to service outcomes.
The mechanism is correlation. When application performance monitoring shows transaction latency climbing, the network layer should be able to confirm or rule out congestion on the relevant path within minutes. When it cannot, teams default to the oldest ritual in IT: the network team blames the application, the application team blames the network, and the outage clock keeps running.
Pages of switch metrics consistently get ignored until they are tied to a service someone cares about. The most useful views we build are service-oriented: this application depends on these switches, these links, these paths. When any element degrades, the impact is stated in business terms, not port numbers.
This is also where end user experience monitoring earns its place in a data center strategy. Infrastructure metrics describe what the system is doing. Experience metrics describe what people are getting. The distance between those two numbers is where reputations are lost.
Monitoring does not exist to prove the network is up. It exists to prove the service is working.
7. Put Trained Eyes Behind the Dashboards
Tools detect. People diagnose. Uptime Institute research shows that nearly 40 percent of organizations have suffered a major outage caused by human error in the past three years, overwhelmingly tied to procedures that were ignored, inadequate, or missing. A monitoring platform without a disciplined operational practice around it is a very expensive screensaver.
That practice includes runbooks for common alert types, escalation paths that function at 3 a.m., post-incident reviews that update thresholds, and continuous coverage. Networks do not fail on a business-hours schedule, and an alert that waits eight hours to be read might as well not exist.
This is the point where many mid-sized organizations hit a structural wall. Building 24/7 coverage in-house means staffing multiple shifts of engineers who can interpret switch telemetry, correlate it across layers, and act. For most teams, that math does not work. It is why network monitoring services exist as a category: the tooling, the baseline discipline, and the expert human analysis arrive as a service, without the hiring problem.
Whether you build or buy, the principle stands. The maturity of your monitoring is not measured by your dashboard count. It is measured by what happens in the first fifteen minutes after an alert fires.
Key Takeaways
- Baseline before you alert. Thresholds without baselines are guesses.
- Monitor switch health and switch traffic as separate disciplines with separate signals.
- Configuration changes cause more network outages than hardware does. Track them accordingly.
- Dynamic, baseline-driven thresholds beat static numbers and reduce alert fatigue.
- Modern data center networking technologies demand flow data, telemetry, and packet-level visibility, not just SNMP.
- Tie switch metrics to application and user experience, or they will be ignored.
- Detection is automated. Diagnosis is human. Plan for both, around the clock.
Conclusion
Effective data center network monitoring is not a purchasing decision. It is a set of practices: baseline before alerting, separate health from traffic, treat configuration changes as the leading outage indicator they are, tune thresholds to reality, extend visibility into virtual and software-defined layers, connect network data to service outcomes, and keep skilled people in the loop at all hours.
Teams that follow these seven practices find problems in minutes instead of reconstructing them in postmortems. Teams that skip them own excellent dashboards and recurring surprises.
If your organization wants the first outcome without building a 24/7 operations function from scratch, Splitpoint Solutions provides managed monitoring across networks, infrastructure, and applications through the Mivu platform, with expert engineers analysing the data and responding to alerts. Schedule a demo to see how it works in your environment .
FAQ
1. What is data center network monitoring?
It is the continuous collection and analysis of health, performance, and traffic data from switches, routers, and links inside a data center, so that degradation and failures are detected and diagnosed before they affect the applications running on it.
2. Which metrics matter most on a data center network switch?
The core set includes port and uplink utilization, packet loss, CRC and interface errors, discards, latency, CPU and memory usage, and hardware health indicators such as temperature, fan status, and power supply state. Utilization reveals capacity problems. Errors and discards usually surface physical or configuration problems first.
3. How is switch health monitoring different from traffic monitoring?
Health monitoring watches the device itself: hardware condition, resource usage, and error logs. Traffic monitoring watches the data moving through the device: bandwidth, flows, loss, and latency. A switch can fail in one dimension while looking normal in the other, so mature monitoring treats them as separate disciplines.
4. Is SNMP still enough for data center network monitoring?
SNMP remains the most widely supported protocol for device polling, but on its own it is no longer sufficient. Polling intervals miss short-lived events, and SNMP cannot see into virtual switches, overlay networks, or east-west flows.
5. What causes most data center network outages?
Configuration and change management failures are the most commonly cited cause of network-related outages, ahead of third-party provider failures and hardware faults. Human error contributes to a large share of incidents overall, which is why change tracking and operational discipline matter as much as tooling.