Real User Monitoring (RUM) solutions allows companies to analyze user activity and performance in real-time, particularly when users interact with websites or web applications. RUM tracks information from users’ web browsers, providing crucial data regarding application usage, users’ experience, and performance issues. This blog will highlight the importance of RUM for improving user experience management, site performance as well as increase the conversion rates in the run-up to 2025. Below are 10 Real User Monitoring tools to look out for in 2025 based on the following factors: acceptance, cost, open source, rank, and learning level table.
The Importance of Using an App Monitoring Tool
This post will explain why application monitoring tools are essential.
- Availability and Performance: Application monitoring and performance management tools often work together as an integrated solution, to ensure adequate performance and availability. They help to identify and resolve performance issues that may occur and cause disruptions to user experience, minimizing downtime and optimizing user satisfaction.
- Cost Optimization and Scalability: APM technologies enable the management of complex cloud systems, allowing for scalability as required. They can help to minimize costs by tracking resource utilization and identifying underused resources and optimizing their allocation.This prevents unnecessary expenditure.
- Compliance and Security: APM technologies help organizations identify potential vulnerabilities, enabling them to protect their applications, especially in cloud environments.Centralized monitoring is important to maintain security and compliance when applications are distributed across multiple environments.
- Operational Efficiency: These tools automate monitoring tasks, reducing manual input required by employees. Moreover, they provide comprehensive reports and analytics that enable teams to make data-driven decisions, improving reliability and performance.
Top 10 Real User Monitoring Tools
1. Raygun Real User Monitoring
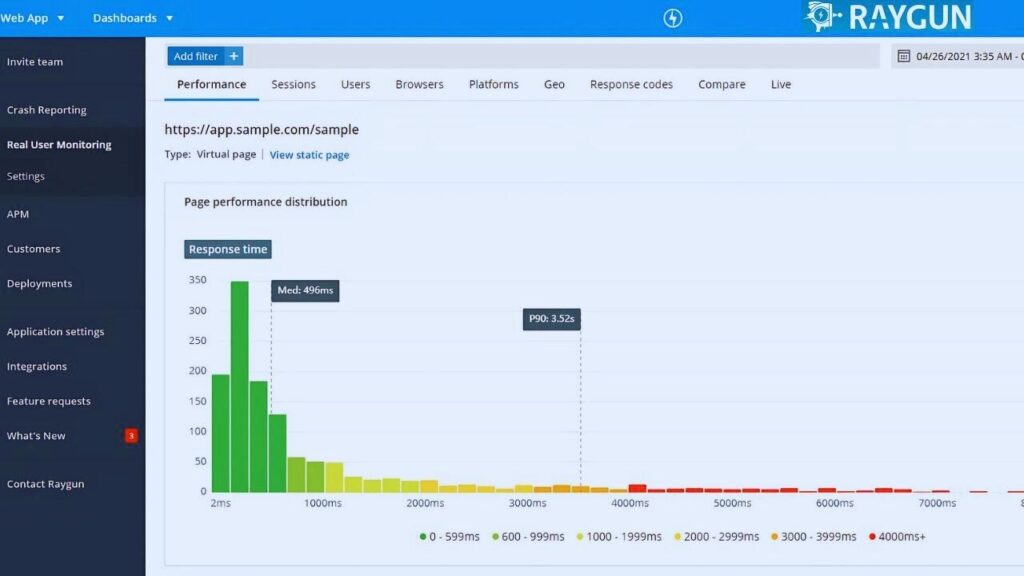
Raygun RUM provides visibility into front-end performance, enabling organizations to quickly identify and resolve issues impacting user experience. It delivers real-user insights across desktop and mobile platforms, supporting a range of technologies.
Key Features of Raygun Real User Monitoring:
- Performance insights: Offers insights into how websites and applications perform for real users. It supports JavaScript, Angular, Xamarin, React, iOS, and Android, providing fast setup with lightweight SDKs.
- Real-time performance monitoring: Tracks performance trends in real time to identify bottlenecks and diagnose issues with instance-level diagnostics. Provides a waterfall breakdown of load times, including DNS, latency, SSL, server, and transfer times.
- User session analysis: Allows for the detailed analysis of individual user sessions, providing insights into every page request. Identifies performance spikes to isolate problematic areas.
- Prioritized actions: Focus on your chosen metrics. Monitor and compare segments, filter data by time, geo-location, browser, and device, and prioritize high-impact optimizations.
- Core web vitals monitoring: Improve and monitor Core Web Vitals with detailed insights specific to your target audience.
2. Datadog
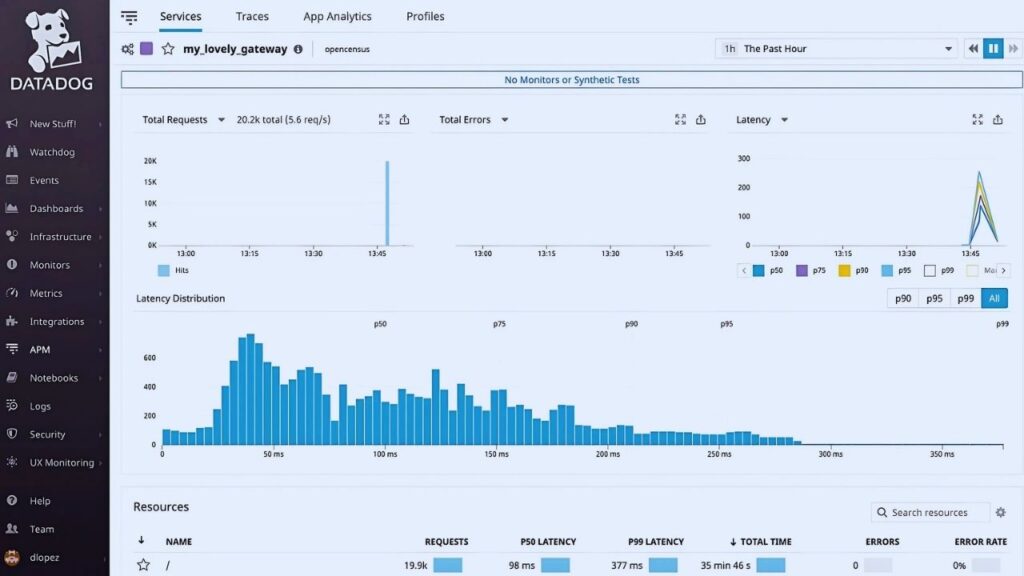
Datadog is a monitoring and analytics platform for infrastructure, applications, and logs. Its Datadog Application Performance Monitoring (APM) offers visibility into your applications’ performance and health. It utilizes AI-powered code-level distributed tracing to monitor interactions from browser and mobile applications to backend services and databases.
Key Features of Datadog:
- Faster detection and resolution of root causes
- Real-time end-to-end tracing
- Intelligent alerts and anomaly detection
- Automatic deployment tracking
- Network performance monitoring
- Synthetic monitoring
- Integration with popular DevOps tools
3. New Relic Browser
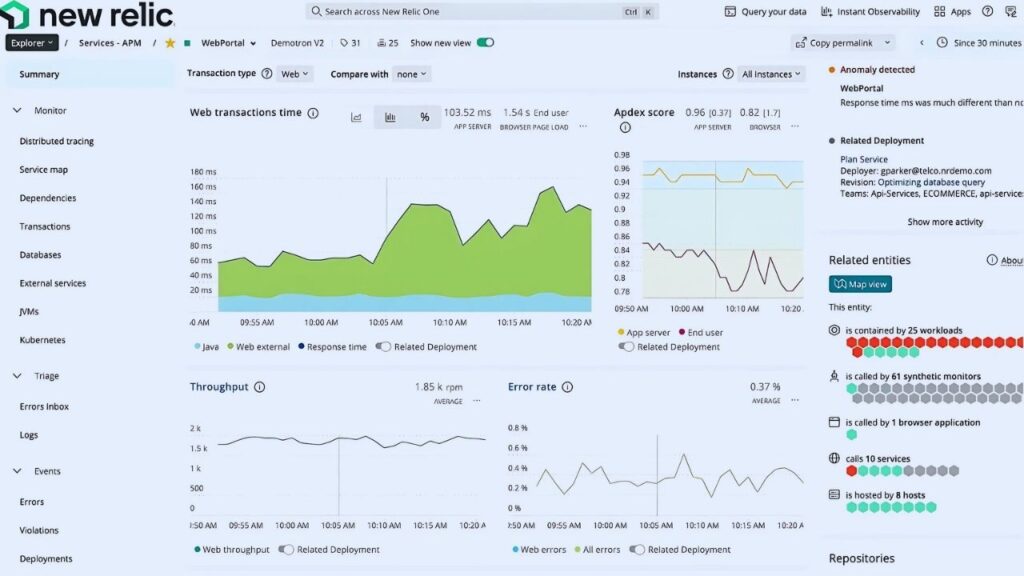
New Relic Browser Monitoring is a tool for refining user experiences through real time user monitoring. It helps pinpoint and resolve backend issues that impact web application performance, ensuring a smooth user experience.
Key Features of New Relic Browser:
- Benchmarking web vitals: Benchmarks your website’s performance metrics against industry standards to identify underperforming pages. This helps in spotting areas that need improvement to meet user expectations.
- User experience tracking: Monitors page performance across regions with filterable global usage maps. This ensures visibility into every user’s experience.
- Error rate tracking: Shows if error rates spike after a deployment, enabling quick rollbacks if necessary. This helps maintain the stability and reliability of your web applications.
- Browser and device impact analysis: Identifies how different browsers and devices affect user experience.
- Frontend issue resolution: Detects pages with underperforming Core Web Vitals that might impact SEO. Offers distributed tracing to connect browser incidents to backend code and resolve issues.
4. Dynatrace
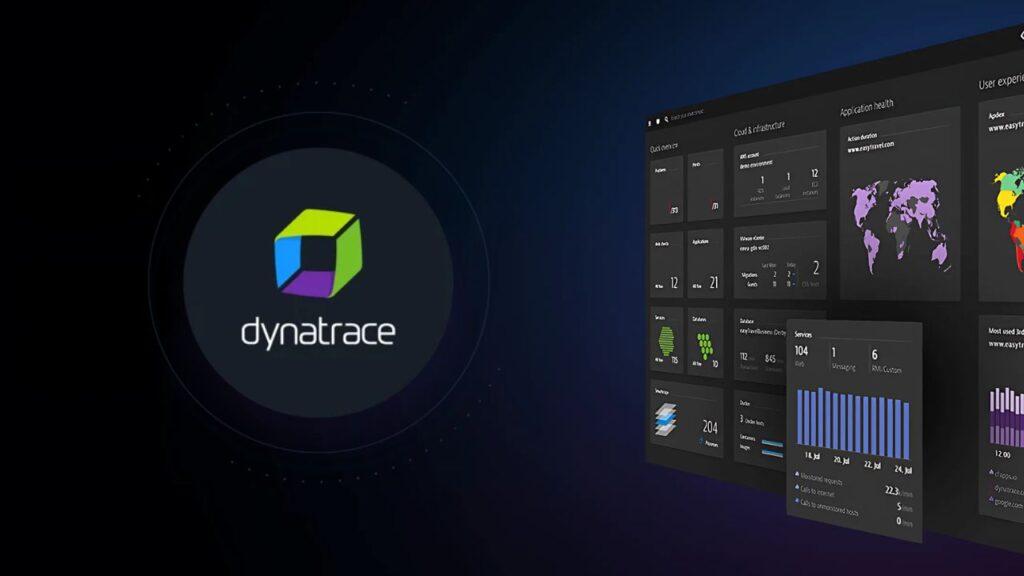
Dynatrace monitoring infrastructure across on-premises, cloud, and hybrid environments. It offers insights into server performance, network health, virtualization, microservices, and containers. It also supports over 650 technologies, helping maintain optimal performance across the entire technology stack.
Key Features of Dynatrace:
- Continuous auto-discovery and topology mapping
- Visual representation of application dependencies
- Integrated user-experience metrics
- Real user data and synthetic transaction monitoring
- Tracking of customer journeys end-to-end
- Database health metrics and SQL statement performance visibility
- Service-to-database dependency mapping
- AI-driven root cause analysis
5. SolarWinds AppOptics
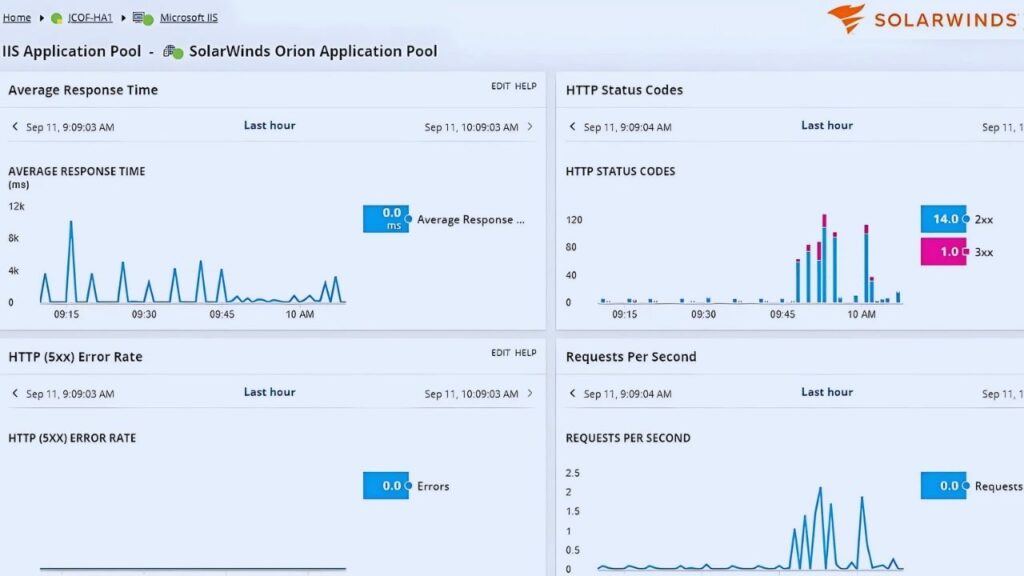
SolarWinds is a full-stack visibility and monitoring platform. It manages IT applications, servers, networks, virtualizations, logs, and security information. Its SolarWinds AppOptics feature supports advanced performance monitoring with distributed tracing, live code profiling, and exception tracking.
Key Features of SolarWinds:
- Native integration with AWS and Azure for cloud monitoring
- Monitors database performance
- Customizable dashboards and detailed reports for performance metrics
- Centralizes and analyzes log data for troubleshooting
- Monitors web applications through its Pingdom feature
- User experience monitoring
- Supports large-scale IT environments
- Flexible deployment options
6. Pingdom RUM
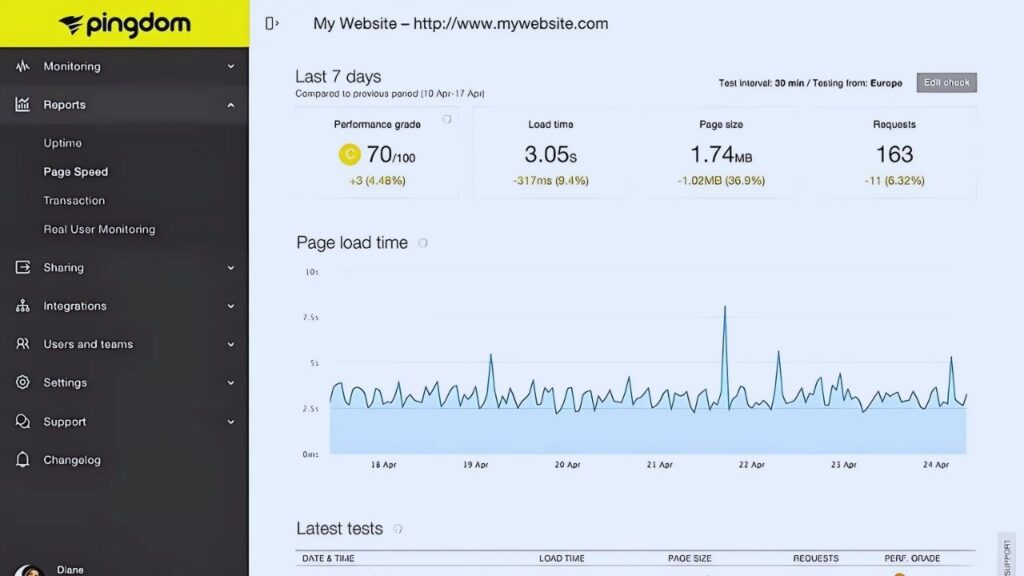
Pingdom RUM offers scalable visibility into how end users interact with your website or web app. It provides fast and accurate client-side problem identification and resolution, helping you optimize user experience.
Key Features of Pingdom RUM:
- Quick deployment: Pingdom RUM is lightweight and easy to deploy with just a snippet of code. You can start viewing live visitor insights within seconds of adding the tag to your site.
- User behavior analysis: Helps understand how and where customers access your website. Filters data by browser, device, and platform to provide insights into user behavior.
- Customer experience optimization: Helps identify and resolve site performance issues affecting the end-user experience management. Shows performance trends over time to inform data-driven decisions that enhance user satisfaction.
- Scalable monitoring solution: Pingdom RUM is event-based, allowing you to monitor millions of pageviews without compromising data fidelity.
- Filtering for bottleneck identification: Identifies performance bottlenecks by filtering real user data based on browser, device, and geographic location.
7. AppDynamics
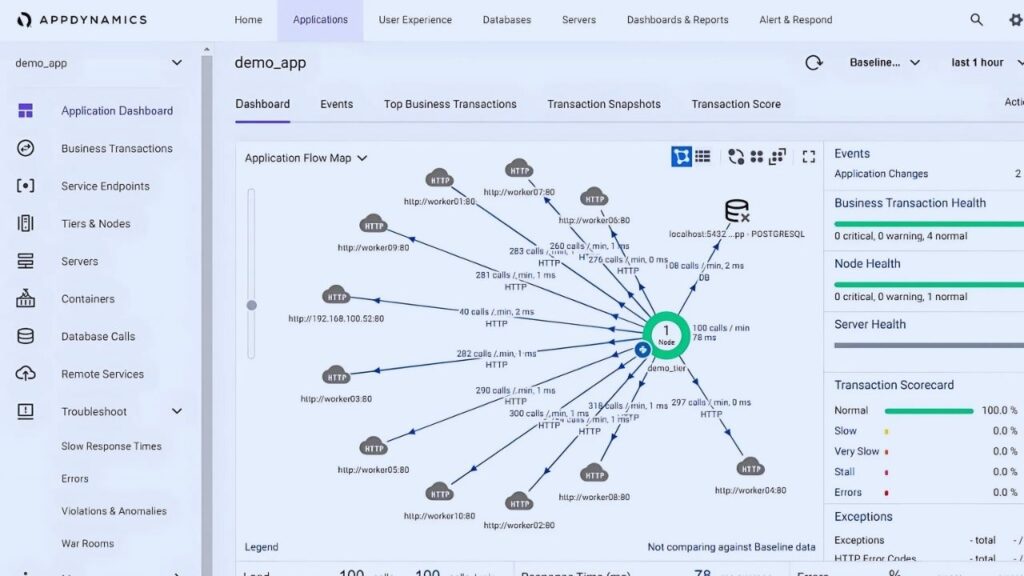
AppDynamics’ End User Monitoring (EUM) tracks web and mobile application performance. It includes Experience Journey Mapping to visualize user interactions and identify optimization opportunities. It also integrates with real-user monitoring (RUM) and synthetic monitoring to detect and resolve performance issues before they impact users.
Key Features of AppDynamics:
- Real-time user monitoring and diagnostics
- Integration with IT and DevOps tools
- Supports cloud-native, on-premises, and hybrid environments
- Visibility across all infrastructure layers
- Offers Business iQ to correlate application performance metrics with business outcomes
- Automatic discovery and mapping
8. Sematext Experience
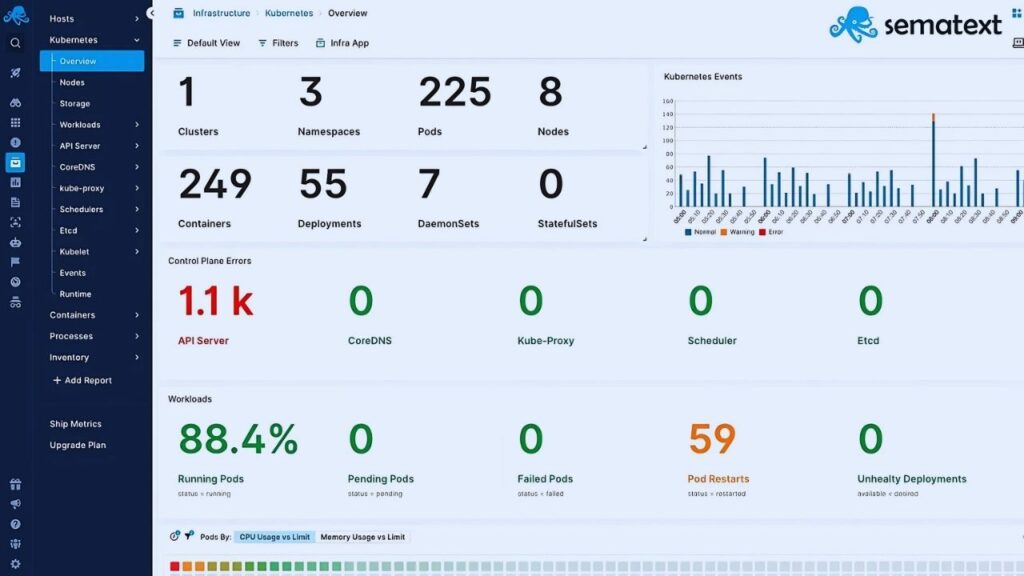
Sematext Experience provides a RUM solution that helps you enhance front-end performance and increase customer satisfaction by analyzing data from real user sessions. It offers real-time anomaly detection and alerts, ensuring a seamless user experience.
Key Features of Sematext Experience:
- Visibility and performance optimization: Allows you to track page loads, HTTP requests, resources, UI interactions, and more, helping you reduce performance-related issues effectively.
- Real-time alerts and issue detection: Delivers real-time alerts when a bug affects performance or user satisfaction. This immediate feedback helps your DevOps and BizOps teams manage and improve customer experience.
- Page load analysis: Provides a resource waterfall view showing assets that slow down your pages. Each page-load event is recorded and displayed on charts, providing insight into the time spent on the backend and in the browser.
- Single page application (SPA) support: Monitors page performance and resource usage for SPAs built with frameworks like React, Ember.js, Angular, and Vue.js. Inspects all HTTP requests and resources to diagnose performance issues.
9. Instana
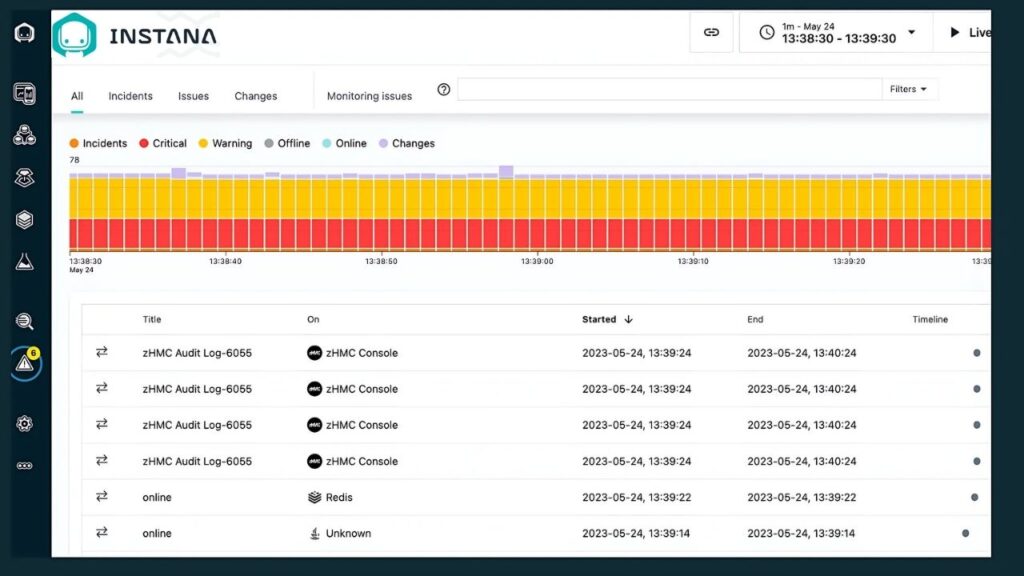
Part of IBM Instana offers real-time visibility into servers, containers, and databases. It automatically uses AI-powered monitoring to discover and map applications, services, and infrastructure. It ensures precise tracking of performance and health across on-premise, cloud, and hybrid setups.
Instana agents collect detailed metrics every second, enabling rapid issue detection and resolution. The platform automates alerts and fixes. It links performance data and events to find root causes quickly.
Key Features of Instana:
- Distributed tracing
- Smart alert
- Service quality management
- Continuous deployment support
- Contextual insights
- Integration with DevOps tools
- Synthetic Monitoring
10. HoneyComb

Honeycomb is an observability tool for DevOps and CI/CD processes. It features detailed insights into production systems, enabling fast debugging and incident resolution. Honeycomb integrates with CI/CD pipelines and supports automated tracing, real-time monitoring, and performance optimization.
Key Features of HoneyComb:
- Real-time complex dependency mapping
- Distributed tracing
- Service Level Objectives (SLOs)
- Team collaboration tools
- OpenTelemetry integration
- Automated incident detection
- Timeline markers
Conclusion
Real User Monitoring (RUM) tools are essential for gaining insights into actual user experiences and application performance monitoring in real time. By capturing detailed data on user interactions, performance metrics, and error occurrences, RUM tools help developers and IT operations teams optimize applications, ensure stability, and improve user satisfaction. Implementing RUM tools can lead to more responsive and reliable applications, ultimately enhancing the overall user experience and supporting business objectives.